For this project I explored the data published by the National Department of Mineral Production (DNPM in Portuguese), available in their website . The dataset documents the areas that are registered by this department, which is responsible for regulating and authorizing mining activities in Brazil. The dataset has information about the materials being explored, companies involved in different stages of mining, dates, areas, locations, among others.
The dataset is big and has many variables, which makes it difficult to identify patterns in a simple analysis. I was able to explore and generate visualizations for interesting relations within the data using the tools we learned this semester.
The following graphs are an exploration of some aspects of the mining activity – time, space, materials and actors - through the investigation of where mining is happening, and which companies are active in the mining process.
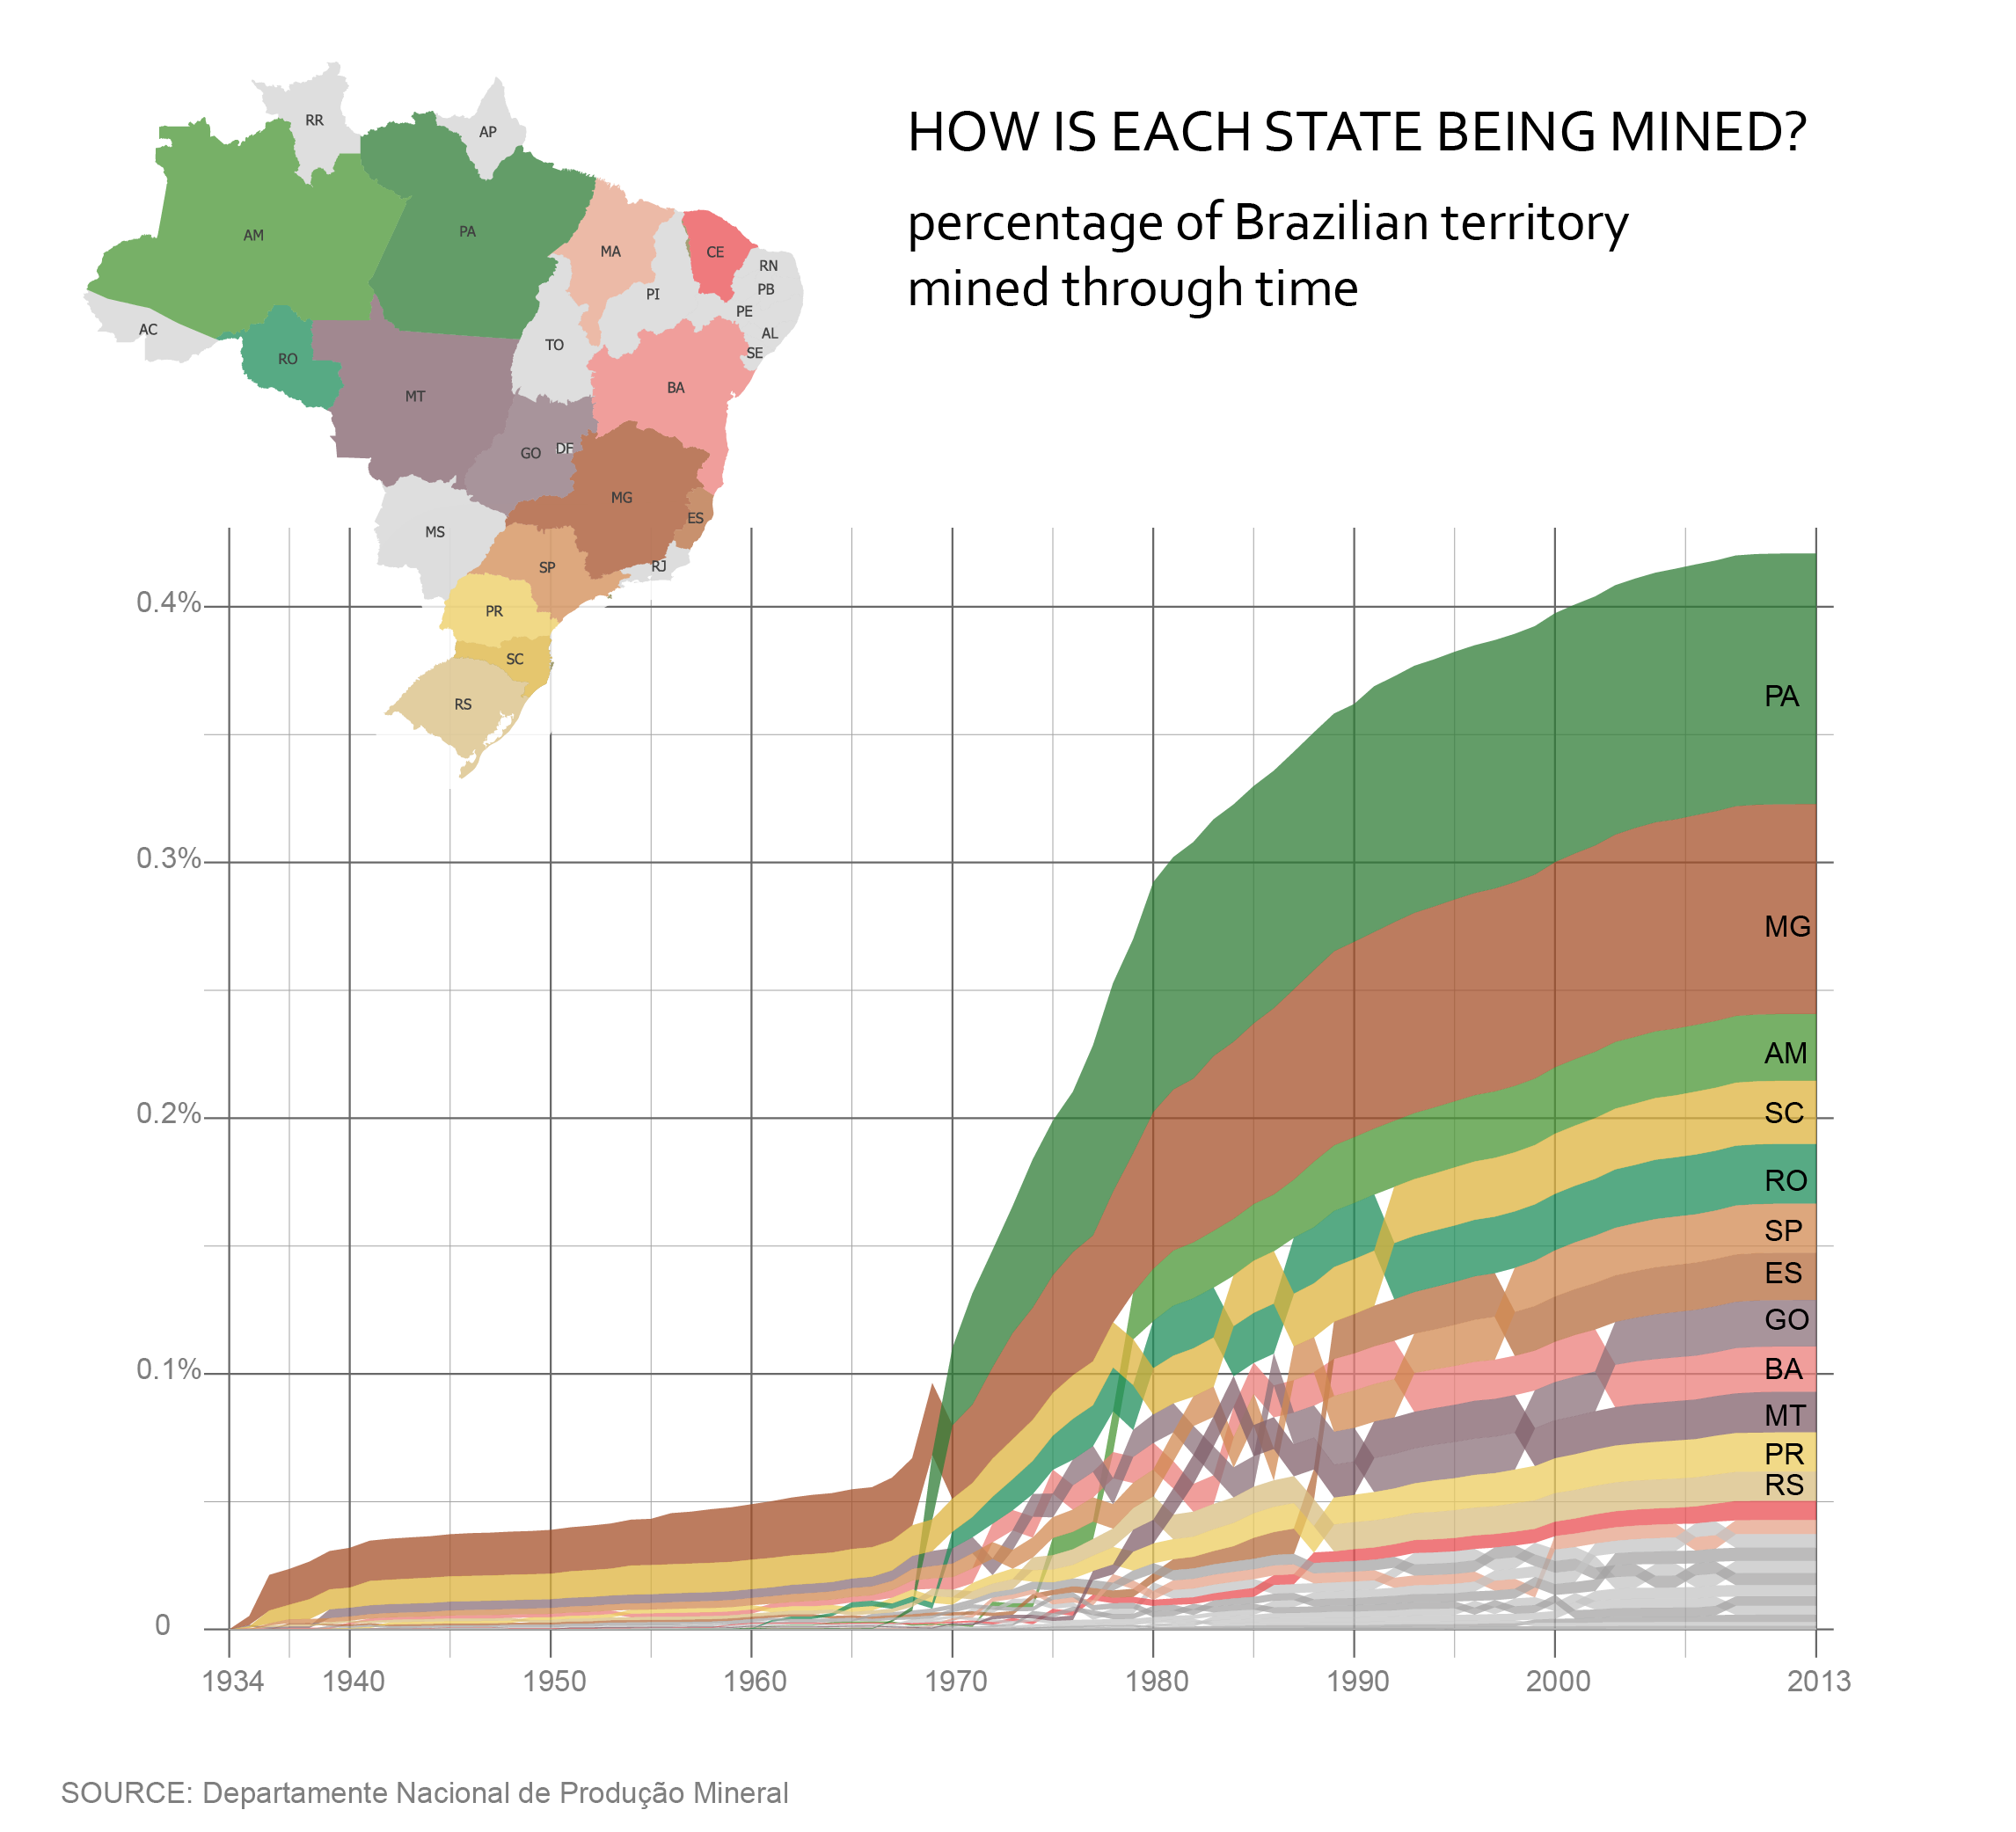
interesting to notice in this graph:
:: there is a clear boom in the mining activities happening in the 70s and 80s, and indeed this is a key point in brazilian history - the Brazilian economic miracle, the military dictatorship focus on resource exploitation and the adoption of free trade practices opened the doors for imports and exports.
:: in this same period Para begins to grow in significance coming to be the biggest state in terms of area explored - historically, this is marked by the discovery of Carajas mine, today one of the largest mining exploration fields operating in the world.
:: it is known that Minas Gerais has a major role in mining activities since the beginning of the colonization, but it was interesting to notice that Santa Catarina also had an important role in early years.
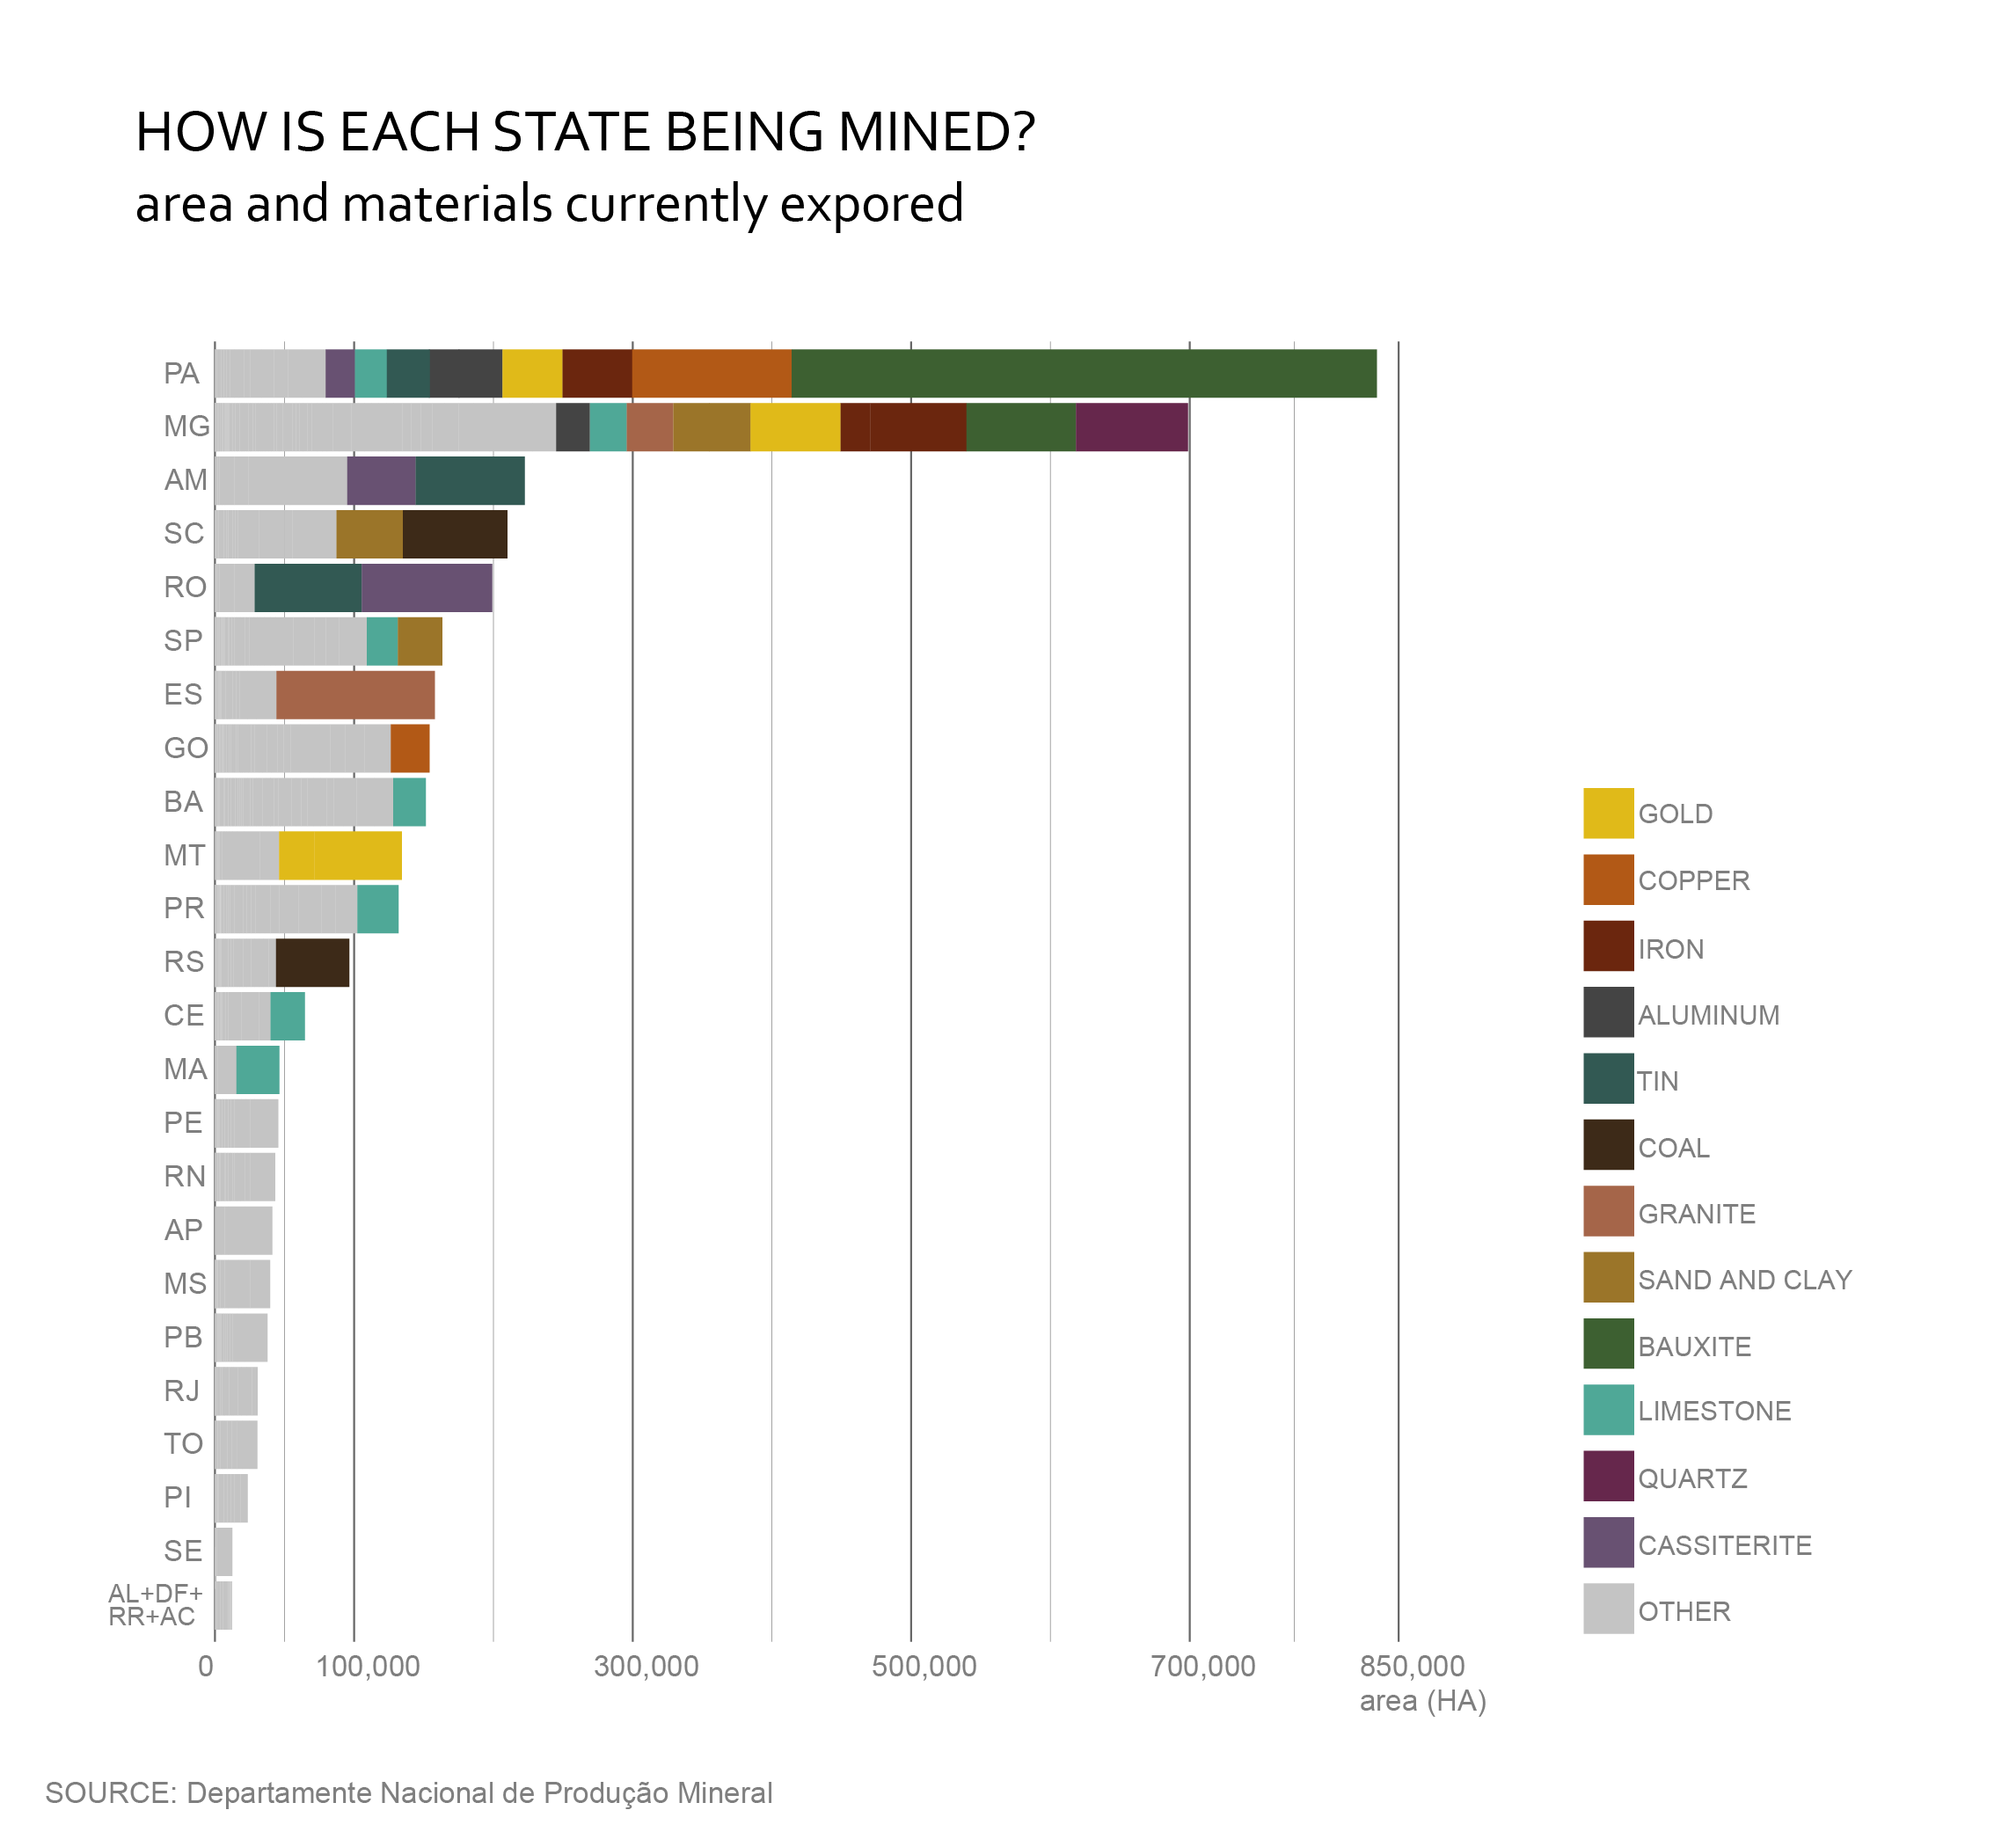
interesting to notice in this graph:
:: bauxite, a mineral used for aluminium production, was the material that led to the exploration of Carajas, which is evident as approximately half of the operations happening in Para are for bauxite extraction.
:: the North region is also marked by the exploitation of cassiterite and tin, as observed in Para, Roraima and Amazonas.
:: the south region is marked by the extraction of coal, observed in Santa Catarina and Rio Grande do Sul.
:: Minas Gerais has a variety of materials being extracted, mainly quartz, bauxite, iron and gold, but no single one stands out.
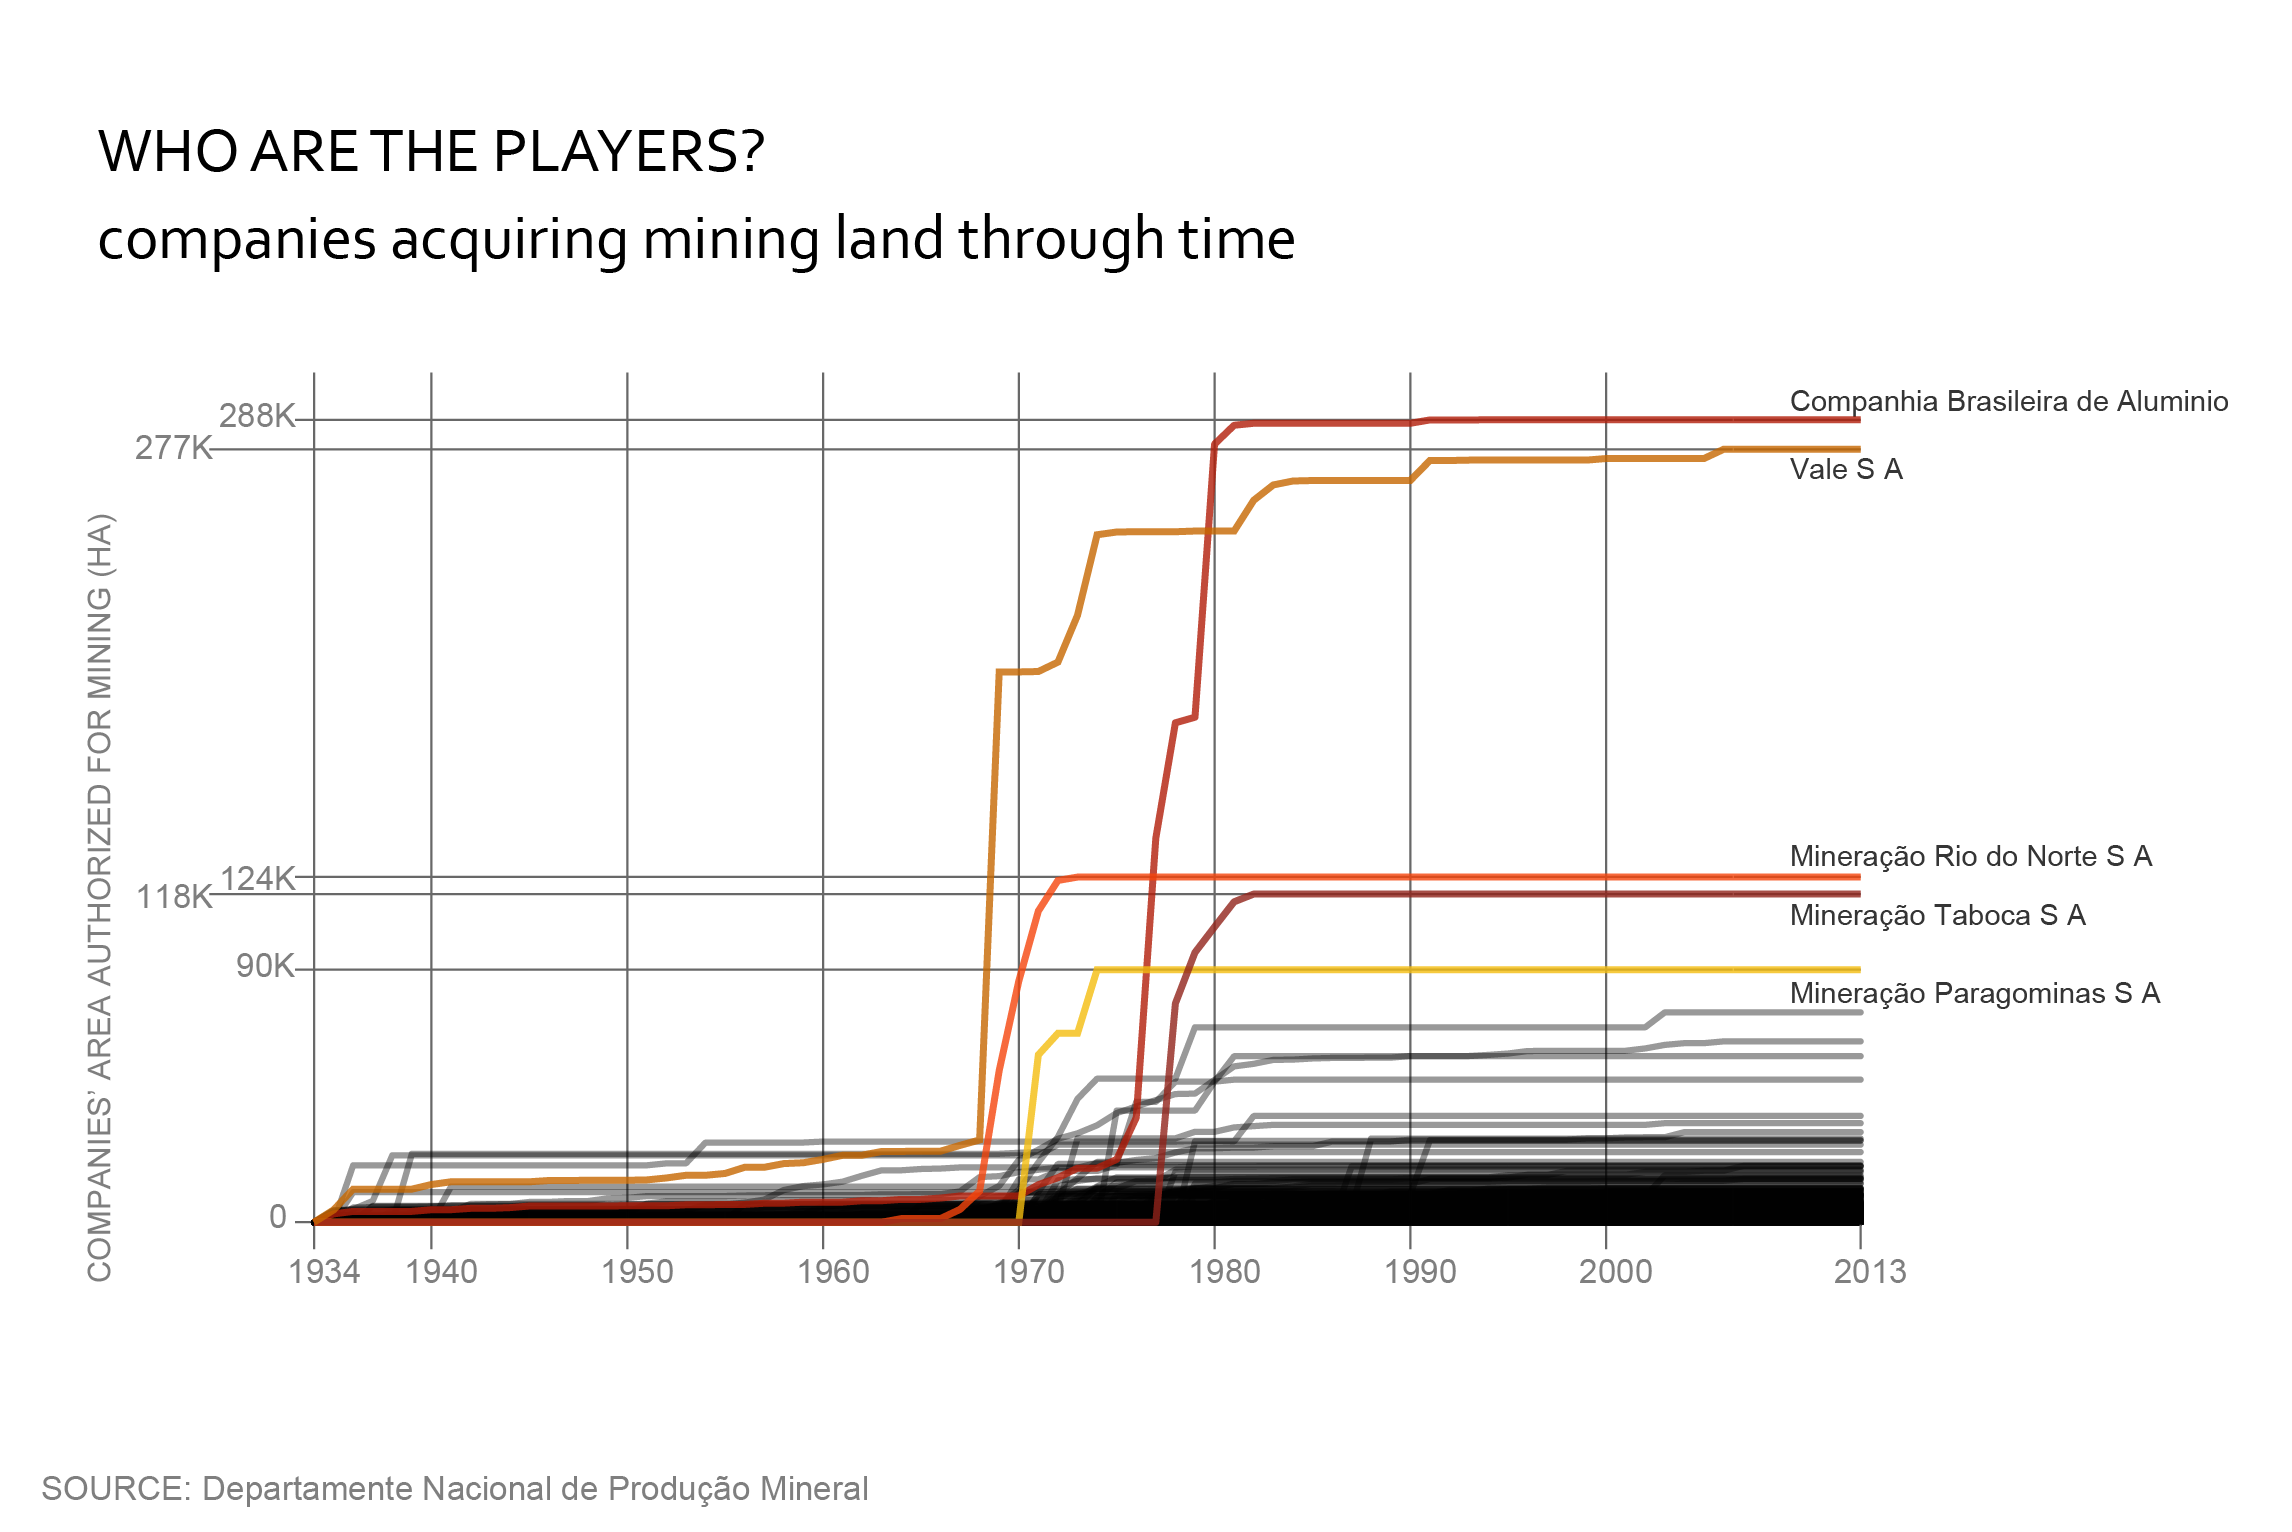
interesting to notice in this graph:
:: this graph supports the one showing area mined in each state through time, as it is evident that in the 70s and 80s there was a boom in activities. Here it is clear that this boom was led by two main companies.
:: not evidenced in this graph but worth investigating is the shift that happened in the 90s, when main mining companies, such as Vale, were privatized.
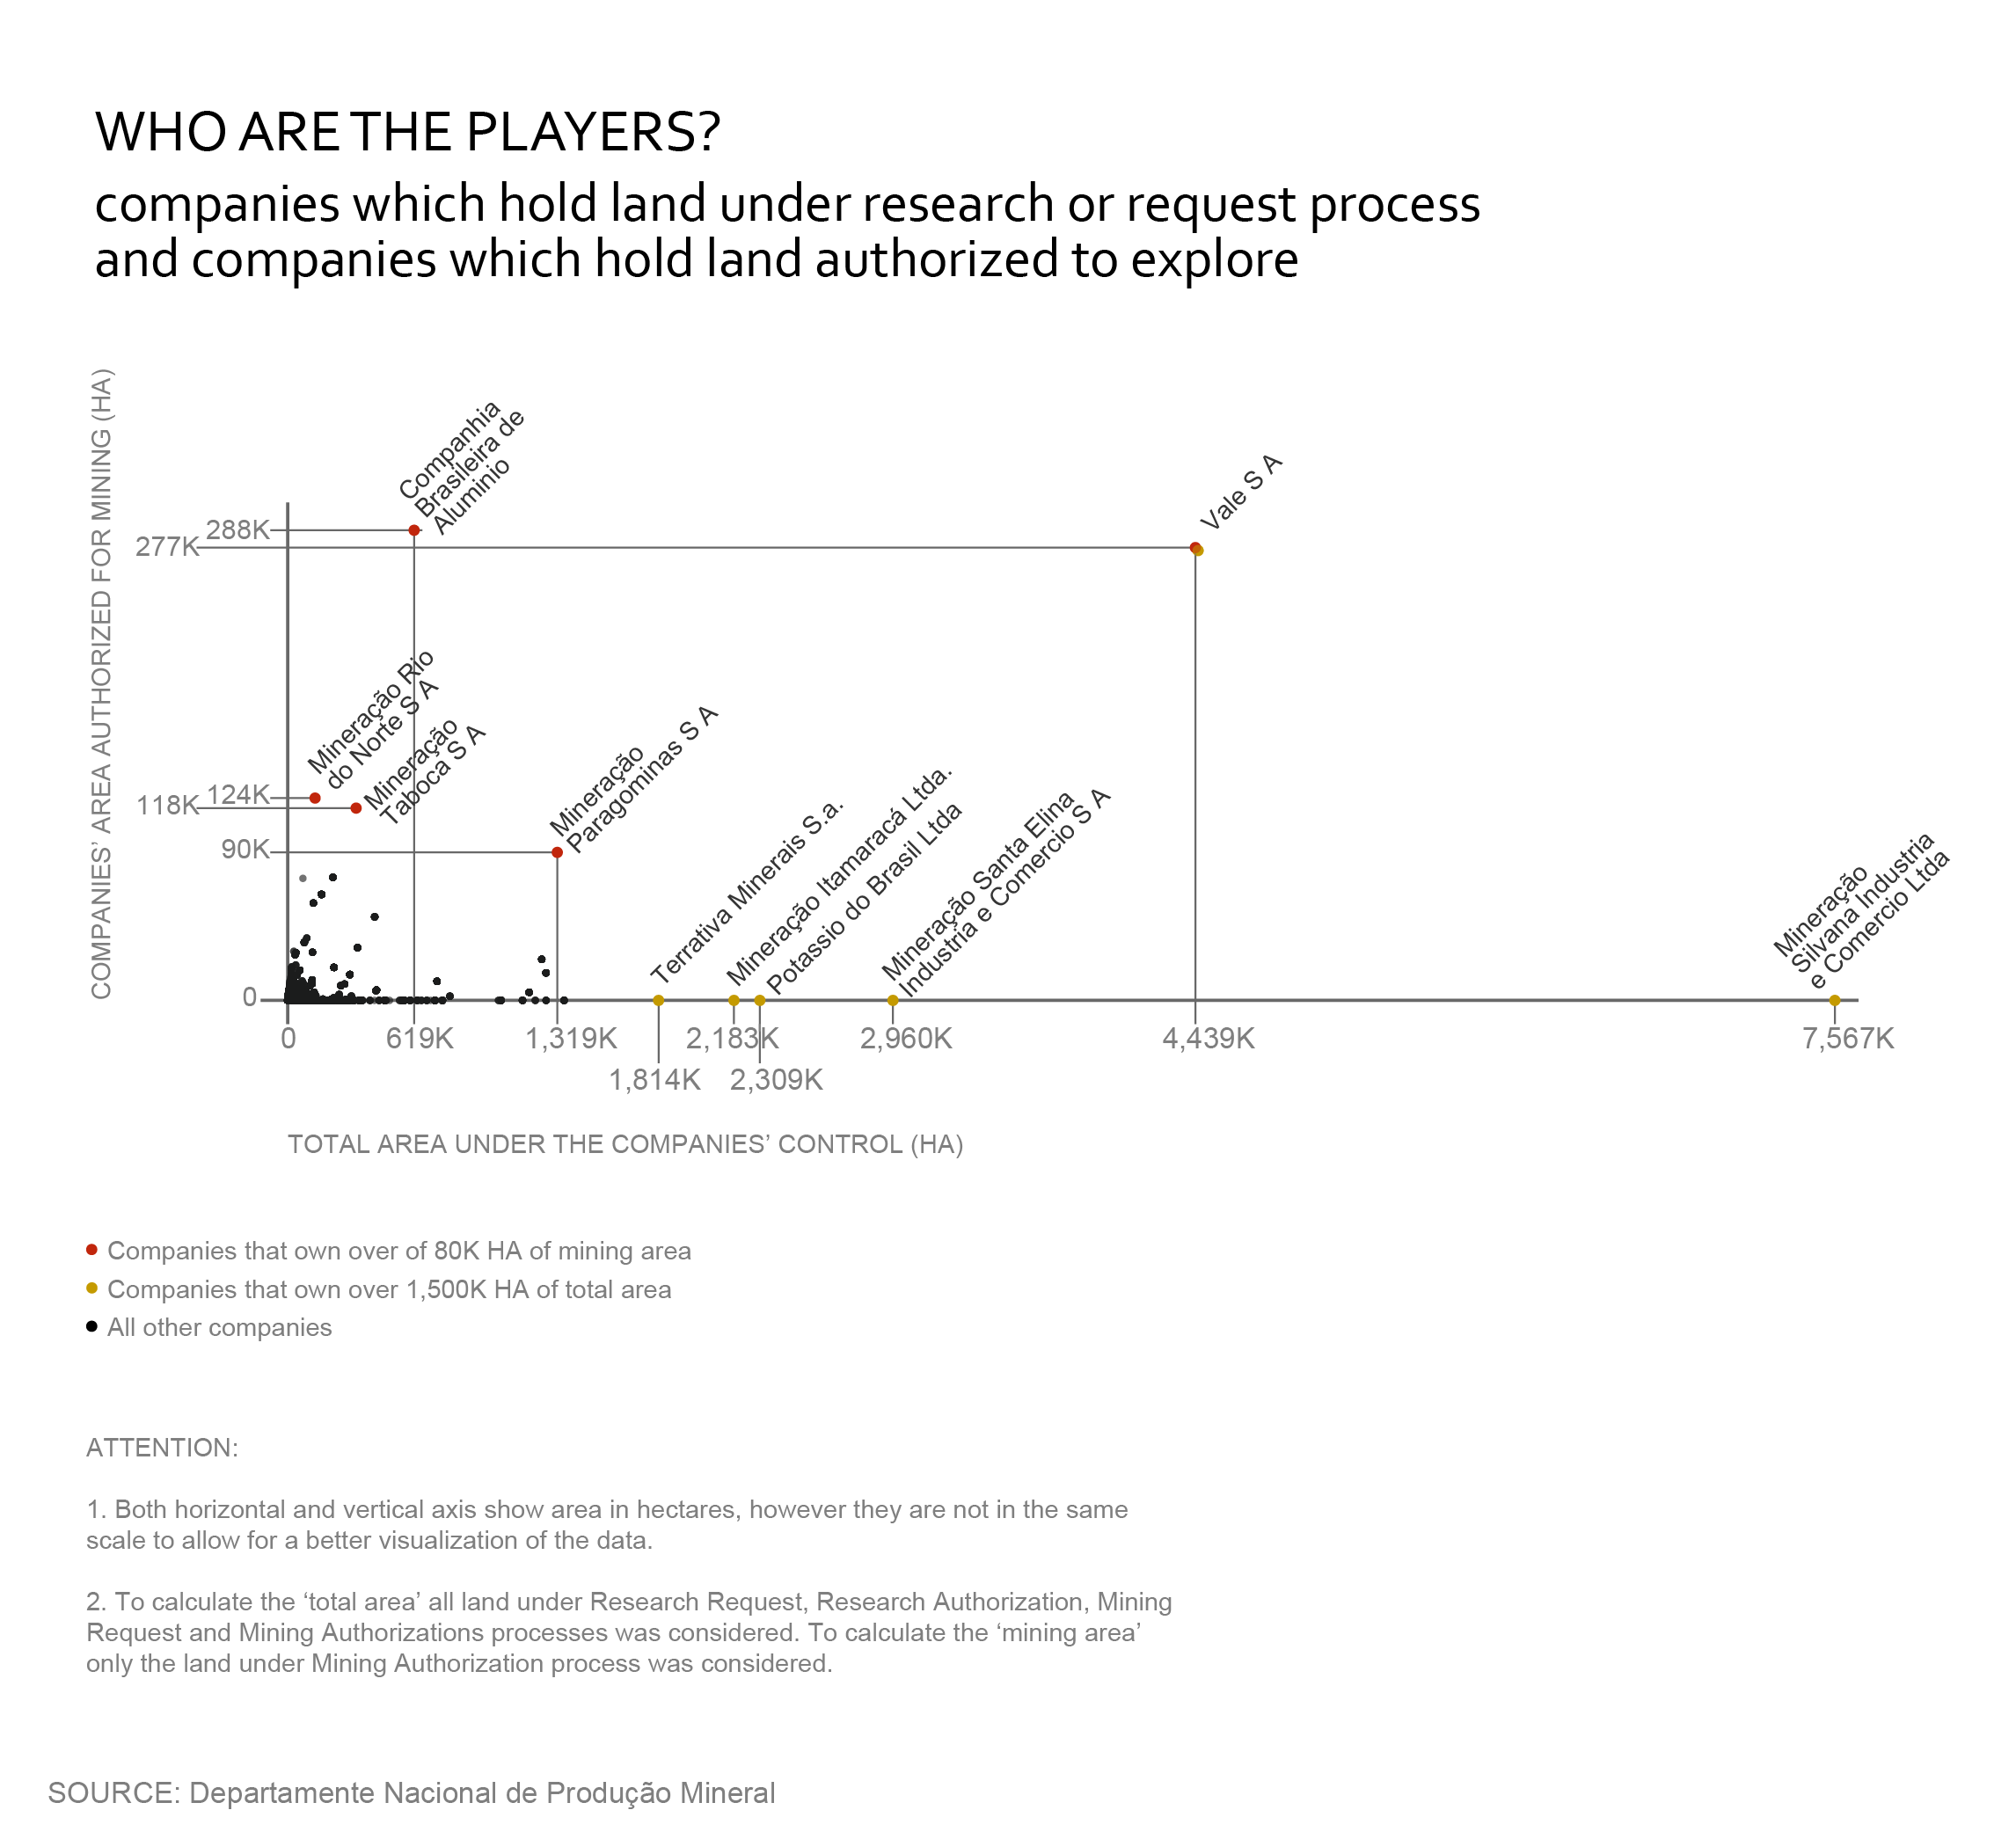
interesting to notice in this graph:
:: mining activity is preceded by research, which is a long and crucial step to ensure the success of the investment. There is an estimate that only 1% of the area that is researched actually turn into mining. This is evidenced in this graph, as there is a huge amount of land under process of research and authorization, and a relative small amount of land authorized for mining.
:: although not possible to conclude only from this graph, it is possible to speculate that there are some companies to carry out research, and some to explore - the companies which have largest amount of land in the pre-mining process have almost no land being mined. it is allowed by law that a company transfer to another the rights to exploit a certain site, after research in complete.